
![]()

Wappinger Capital Research: 20 July 2017
 Summary
*Five of the largest oil sector firms all move directly with the price of oil, but at varying degrees.
*ConocoPhillips has historically moved at an almost dollar per dollar ratio to oil.
*Shell and BP are far less sensitive to the change in oil prices as their American counterparts.
*BP has a quarter of the sensitivity to the price of oil as ConocoPhillips does.
By Eric Mason
As oil approaches its consensus floor for price per barrel, the next move can only be upwards. To take advantage of this pending uptick, which of the major oil sector firms offers the best growth relative to the price of oil? This article will help shine some light on which stock is the best pick for gains.
This approach is based on historical monthly data starting in December of 1987 and ending in June of 2017. The reason monthly data was used instead of weekly or daily is twofold. The first reason is that this approach is looking over the long term and monthly data helps to smooth out any micro-misvaluations and outlier price swings that are important in some models, but not in one that is trying to gain a general sense of how the stock prices relate to an economic indicator. The second is a more practical reason; the Federal Reserve Database ((NASDAQ:FRED)) series being used is only recorded in monthly intervals.
Five major oil sector companies were chosen for this analysis: Exxon Mobile Corporation (NYSE: XOM), ConocoPhillips (NYSE: COP), Chevron Corporation (NYSE: CVX), British Petroleum p.l.c. (NYSE: BP), and Royal Dutch Shell p.l.c. (NYSE: RDS.A). The price per barrel of oil is coming from the FRED data series titled “Global price of WTI Crude.”
To start the framing of the best choice to carry gains from rising crude prices, a graph of the indexed changes in the stock price of the five firms chosen was constructed. For added depth, the oil price data was indexed and included. All data is indexed to 1/1/2000. Stock prices are adjusted close price.

An interesting picture is painted from these six data series. The stocks, to no surprise, move in concert with the price of oil, while the sensitivity to crude movement varies, they all seem to have a direct correlation.
Next, is moving beyond the non-committal term “seem.” No investor should be making actionable moves on an analysis that “seems” to show something. Turning that “seem” in to a more solid term, like statistically significant correlation; can be done through a series of regressions that tests if the value of a barrel of oil is effecting the value of the stocks. That is exactly what was done and the results were put into a table below.

Each test showed that there is a statistically significant relationship between the price of oil per barrel and each stock’s price. When everything is processed, it shows what to expect in share value increase of each company as oil prices rise. This modeling is not just simply dividing the change in a stock’s value by the change in oil price, and then normalizing the result; it is the product of individual linear regressions involving the value of oil and the identified stock. Using a regressive model gives a more in depth result that also dismisses the likelihood that this is just coincidence. The upper bound and lower bound show where 95% of all results are expected to land, which is plus or minus two standard deviations.
The results range dramatically from firm to firm with ConocoPhillips falling just short of a dollar to dollar match to oil as it rises and British Petroleum barely registering a movement in relation to the price of oil. One of the most interesting takeaways from this result comes from Shell. Shell posts a modest 28 cent movement for every dollar oil moves, but when an investor looks at the range formed from the difference between the upper and lower bounds, it is a tight margin. This shows that Shells’ relationship with the price of crude oil is predictable and expectable; both good signs for investors that wish to have a consistent and reliable growth curve in their portfolio analyses package.
The obvious criticism of this analysis is that it uses historical data to form these results, instead of predictive analytics. While predictive analytics certainly offer an array of benefits that historical data analyses do not, historical analytical approaches offer something that predictive modeling cannot, testing against actual results. By doing so, it can be seen is that this relation largely holds true across about 30 years of observations.
By using three decades of information, a benchmark of expectation is formed of what the anticipated response of some of the largest oil sector firms will be to rising oil prices.
The model works in two ways, if an investor believes oil has bottomed out and it has no place to go but up and it will do so aggressively, then investing long in ConocoPhillips may suit that investor’s wants. If an investor sees the oil market existing for a while at this level or even descending, then Shell would fit that approach. The reason Shell is more appealing for the bearish investor is that it offers the smallest range. Additionally, British Petroleum had a weaker R2 value than Shell, basically, this means British Petroleum was less consistent in its relation to crude prices; the rest of the companies all had similar R2 values.
When all is considered, this approach adds another tool in the investors’ toolbox to try to make an actionable decision of the pending changes in the oil sector.
Disclosure: I/we have no positions in any stocks mentioned, and no plans to initiate any positions within the next 72 hours.
Business relationship disclosure: This article was written by a third party – all opinions are the authors.


 Royal Dutch Shell conspired directly with Hitler, financed the Nazi Party, was anti-Semitic and sold out its own Dutch Jewish employees to the Nazis. Shell had a close relationship with the Nazis during and after the reign of Sir Henri Deterding, an ardent Nazi, and the founder and decades long leader of the Royal Dutch Shell Group. His burial ceremony, which had all the trappings of a state funeral, was held at his private estate in Mecklenburg, Germany. The spectacle (photographs below) included a funeral procession led by a horse drawn funeral hearse with senior Nazis officials and senior Royal Dutch Shell directors in attendance, Nazi salutes at the graveside, swastika banners on display and wreaths and personal tributes from Adolf Hitler and Reichsmarschall, Hermann Goring. Deterding was an honored associate and supporter of Hitler and a personal friend of Goring.

 Deterding was the guest of Hitler during a four day summit meeting at Berchtesgaden. Sir Henri and Hitler both had ambitions on Russian oil fields. Only an honored personal guest would be rewarded with a private four day meeting at Hitler’s mountain top retreat.


 IN JULY 2007, MR BILL CAMPBELL (ABOVE, A RETIRED GROUP AUDITOR OF SHELL INTERNATIONAL SENT AN EMAIL TO EVERY UK MP AND MEMBER OF THE HOUSE OF LORDS:


 MORE DETAILS:


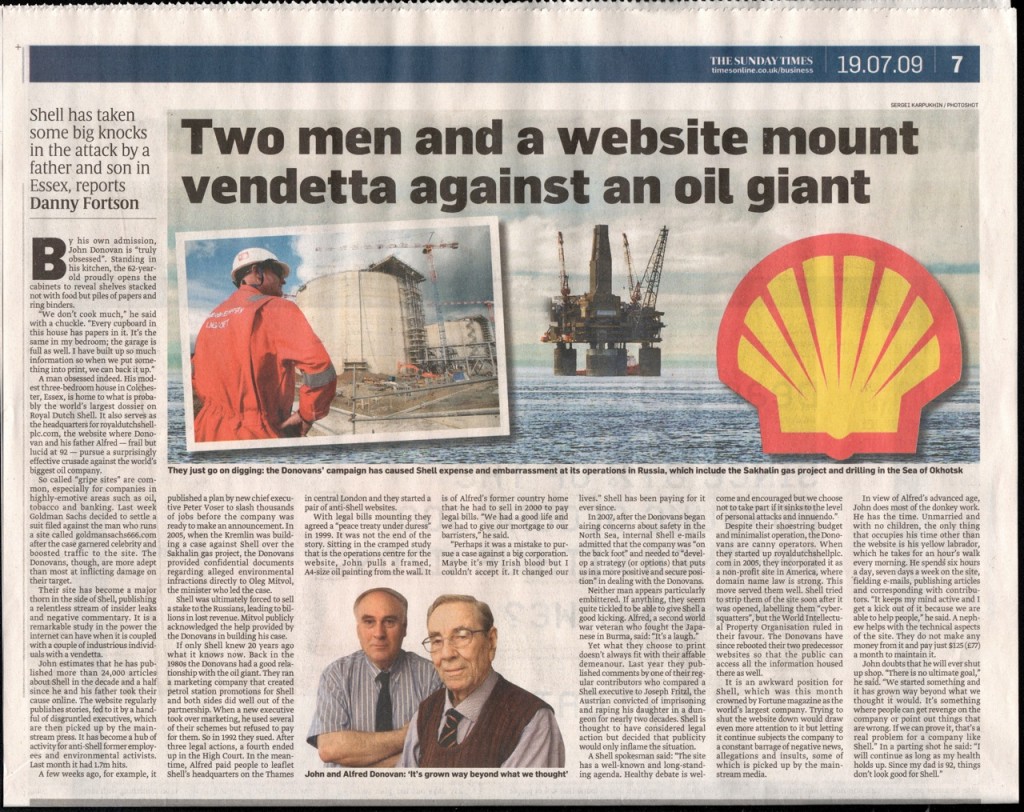
 A head-cut image of Alfred Donovan (now deceased) appears courtesy of The Wall Street Journal.


